Brief
For this project, the point was to make an interesting infographic. My main goals were to make clever comparisons and make it so that people could be informed about water bottles and their impact on the environment.
Research
My first step was to gather information about water bottles. I looked at several websites to find as much information as possible and wrote each down in my notebook. My next step was to make sketches. Unfortunately I am not very good at keeping pictures of my research. I find my direction and then I scribble down anything that might be useful so it is rather messy.
Digital
My next step was to make some sketches of graphics. Then I made them digital. I just make some quick drafts.


Drafts
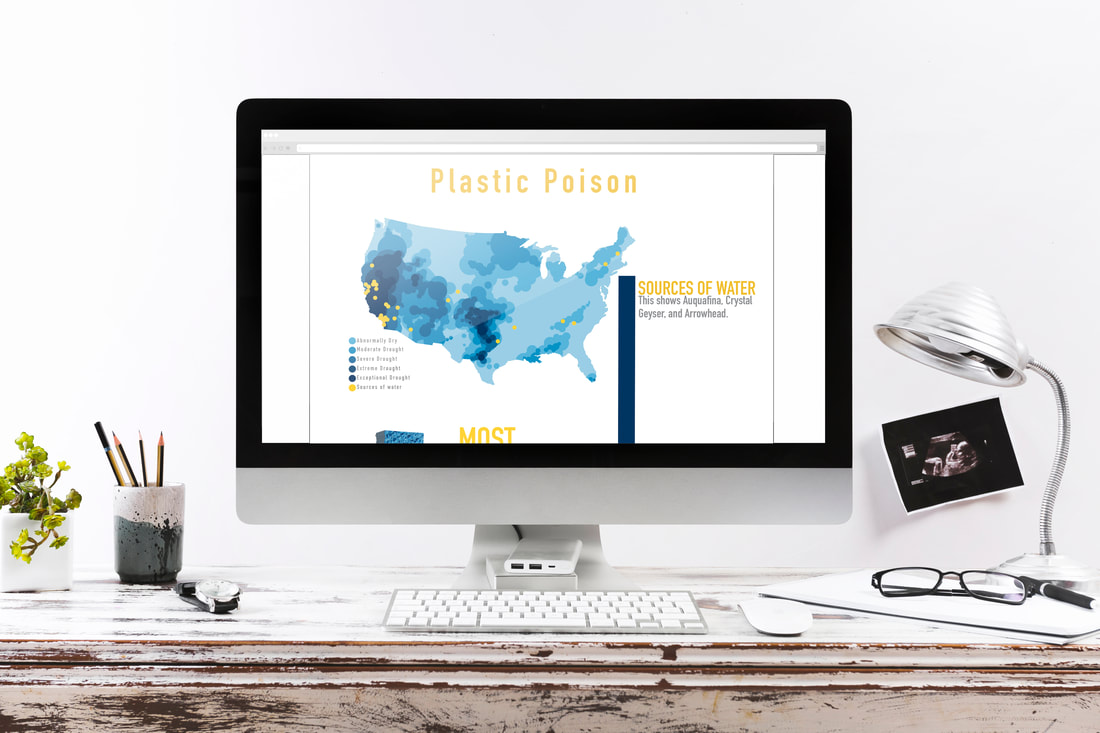
I then refined my images. I also tried arranging them differently to make the infographic.

After making this draft, I noticed a few things I could change and got feedback from peers.

Usability Testing
I then asked several people to look at my infograph. First, I put it in XD and prototyped it. I wanted to make sure it looked good. I noticed some imperfections when I showed the prototype. I noticed that things where very cramped and needed more space. I also found that they were having a hard time knowing what to look at. My solution to this was to space things and add an effect that they could follow.
Final